Exercise – Working with Grafana Dashboards
Overview
Aims
The objective for this exercise is to become familiar with the Prometheus UI and the Grafana UI by importing a new pre-prepared dashboard into your Grafana instance. You have been given a single Linux virtual machine.
Prometheus and Grafana are both running on this machine. The prometheus node-exporter process is also running on this machine so prometheus can scrape metrics regarding the machine’s CPU, Memory, Disk etc.
See Here (Github) for more information on the node-exporter.
Your instructor will provide you with the hostname of your machine. In the instructions below replace <your-hostname> with the hostname of your machine.
Step 1 – Check the metrics are available in prometheus
Firstly we will verify that prometheus has access to the node-exporter metrics.
Open the prometheus console at: http://<your-hostname>:9090
You should see the standard prometheus console similar to below:
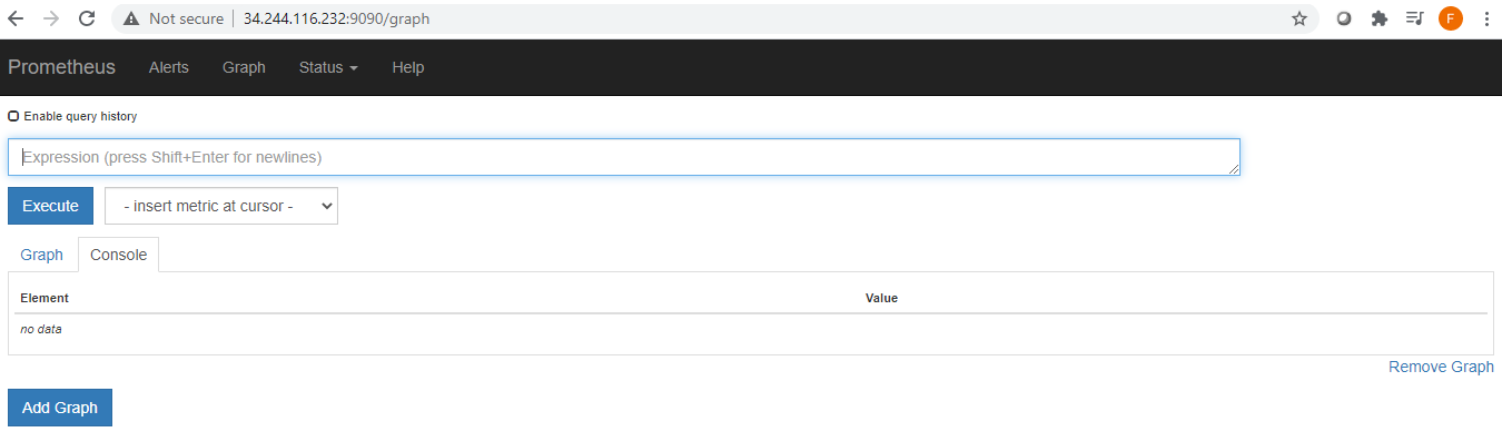
Spend some time exploring the prometheus interface.
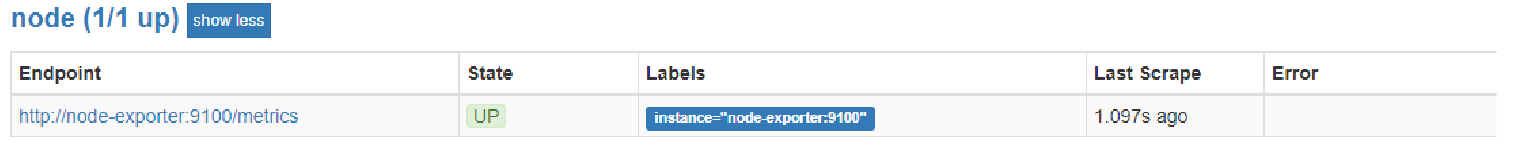
Click on Status->Targets to see the "targets" that prometheus is configured to read from. You would add more targets by changing the prometheus configuration file.
You should notice a target called “node” - this is the node-exporter process that is providing prometheus with data about your linux VM.
Click on Graph to explore some of the data being gathered by prometheus.
The expression box allows you to type PromQL expressions to query prometheus. It will also search available metrics as you type. For example if you type “node” you will see the list of metrics filtered to those containing that word. These are mostly the metrics being produced by the node-exporter process.
E.g. Type node_filesystem_free_bytes in the Expression boxy and click "Execute". This will query prometheus for the metrics with this name.
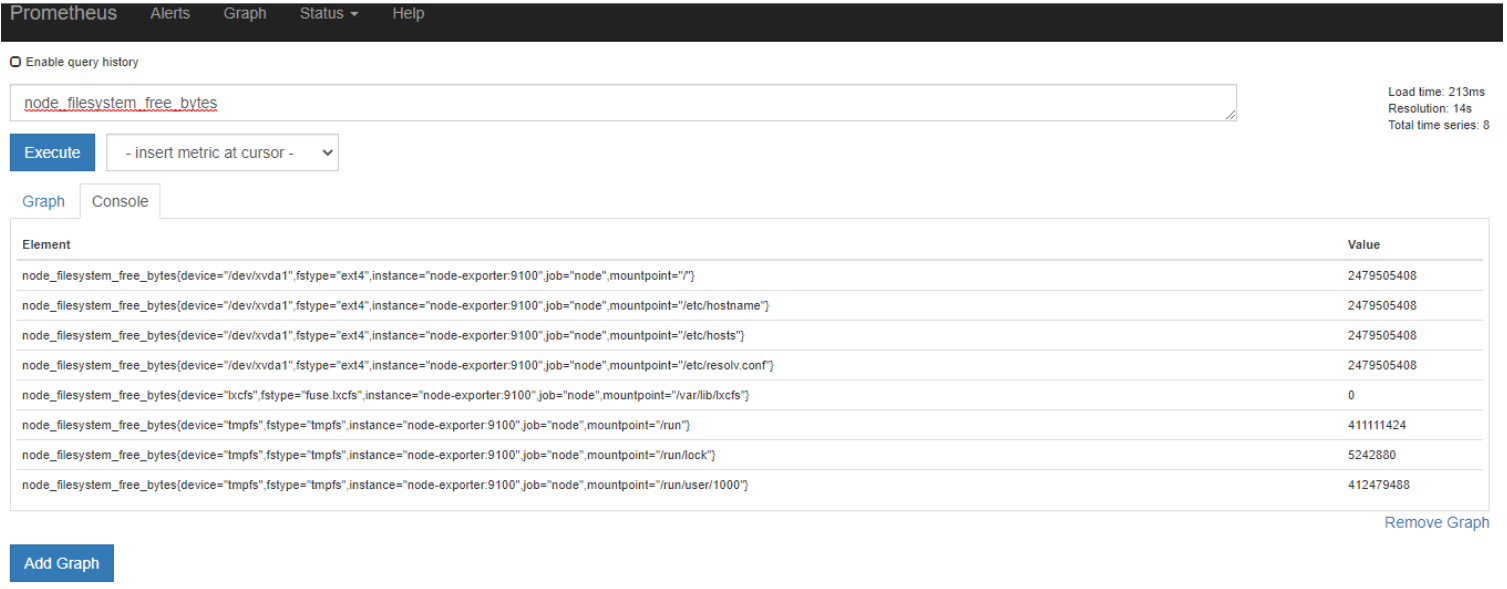
If you click on “Graph” you will see a simple plot of this data.
Step 2 – Import a pre-prepared Grafana dashboard
Now we will import a pre-built dashboard into Grafana that visualised the node-exporter metrics that are being scraped by prometheus.
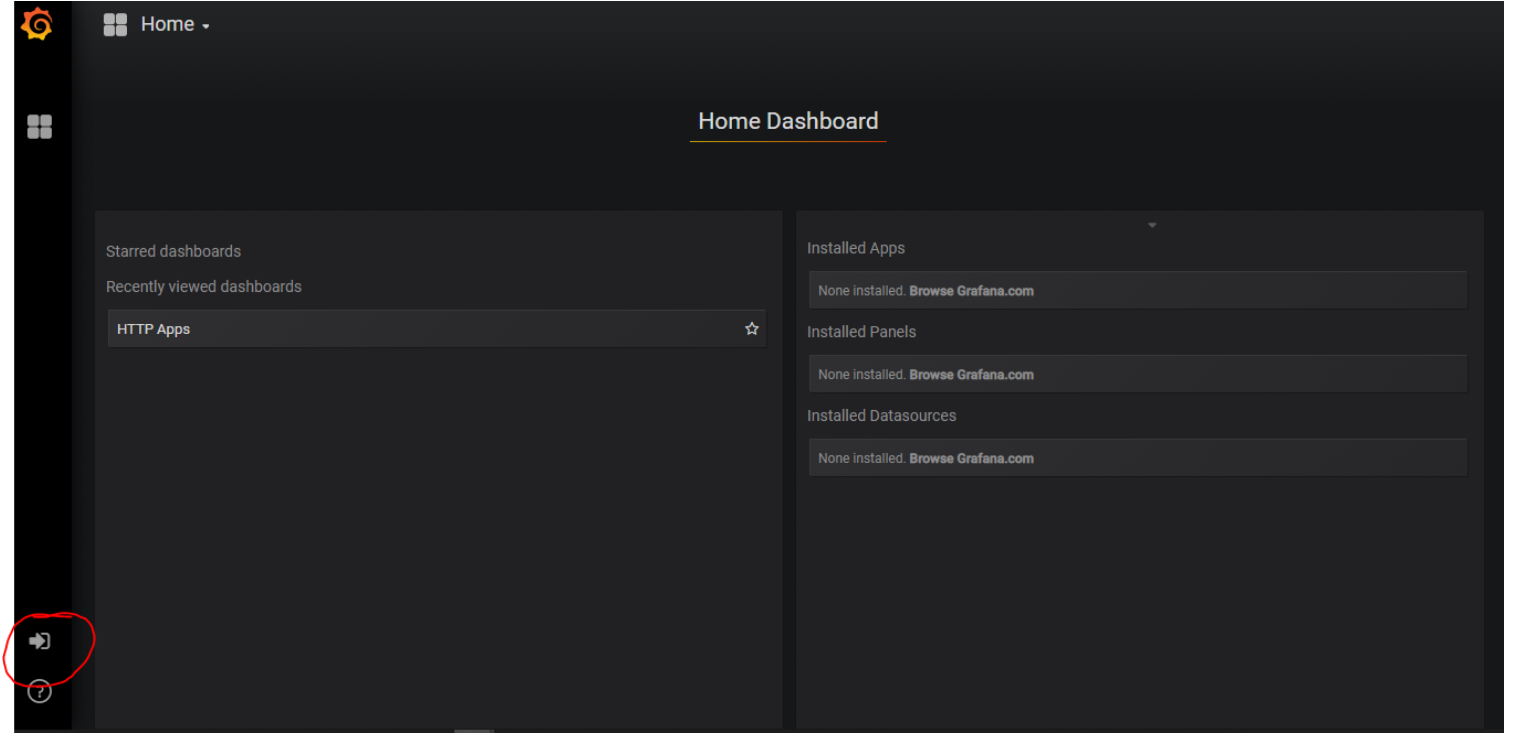
Open the grafana dashboard at http://<your-hostname>:3000
First we will login to grafana by clicking on the login button on the bottom left.
Username: admin
Password: admin
The home dashboard page will allow you to open some dashboards that have already been saved on your machine. Explore the grafana UI to get an initial feel for it.
We will import a new dashboard by clicking on the + on the left panel and clicking "Import".
We will be importing a dashboard from the grafana dashboard library. The dashboard we will import is at: https://grafana.com/grafana/dashboards/13978
You will notice that this dashboard has an id of 13978. We can import this dashboard by putting this id in the “Grafana.com Dashboard” box.
Alternatively, we could import as dashboard in JSON format, upload a JSON file, or give a url to a a JSON file.
For now import the dashboard using the grafana dashboard id. Paste the id into the box and click "Load".
Grafana should identify the dashboard and display it’s name and info. Click “Import” to load the dashboard.
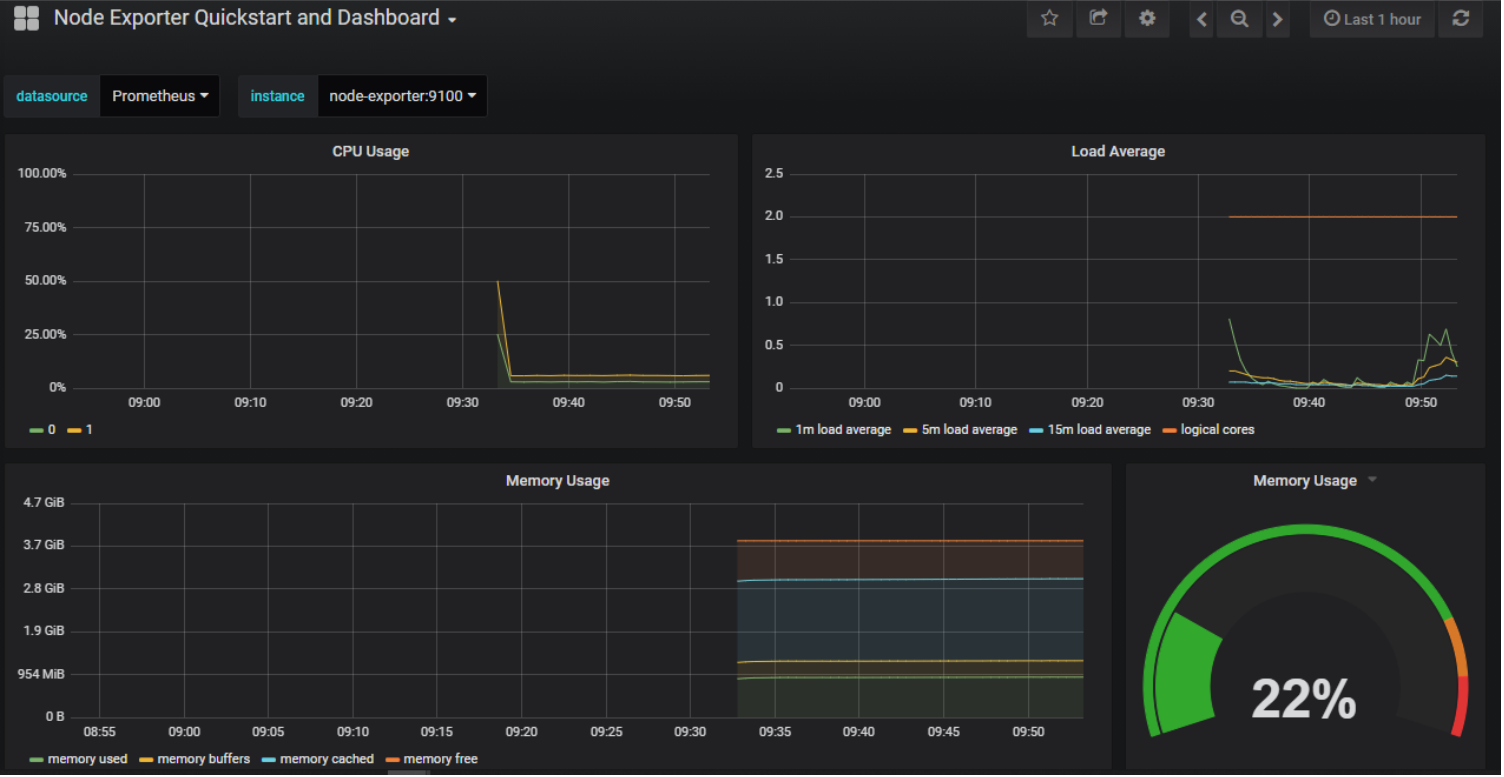
You should now see a dashboard similar to that shown below.
Step 3 – Explore Grafana dashboard structure
Take some time to explore the dashboard screen. You will notice that the dashboard is not "editable", and so you cannot see or change its underlying data. You can make it editable by clicking the "Settings" icon in the top right, the click "Make Editable".
You will notice that you can now see the details of the dashboard e.g. if you click "View JSON" you will see the JSON description of the dashboard.
Dashboards are commonly created in the Grafana UI, but can be stored and shared as JSON text for convenience i.e. you wouldn’t usually spend much time editing the JSON directly.
Make a copy of the dashboard so that we can edit some details.
Click "Save As" and the click "Save" - this will save a copy of the dashboard with the word "Copy" on the end of the name.
You will now be back on the dashboard screen, but now you can edit the dashboard in the UI.A dashboard is composed of multiple panels. Try dragging panels around by "grabbing" their top bar.
To edit the "Memory Usage" panel click the down arrow beside the name and click "Edit". This shows you the panel on it’s own, with the PromQL (prometheus) query that is retrieving data for this panel.
The PromQL query for this panel is:
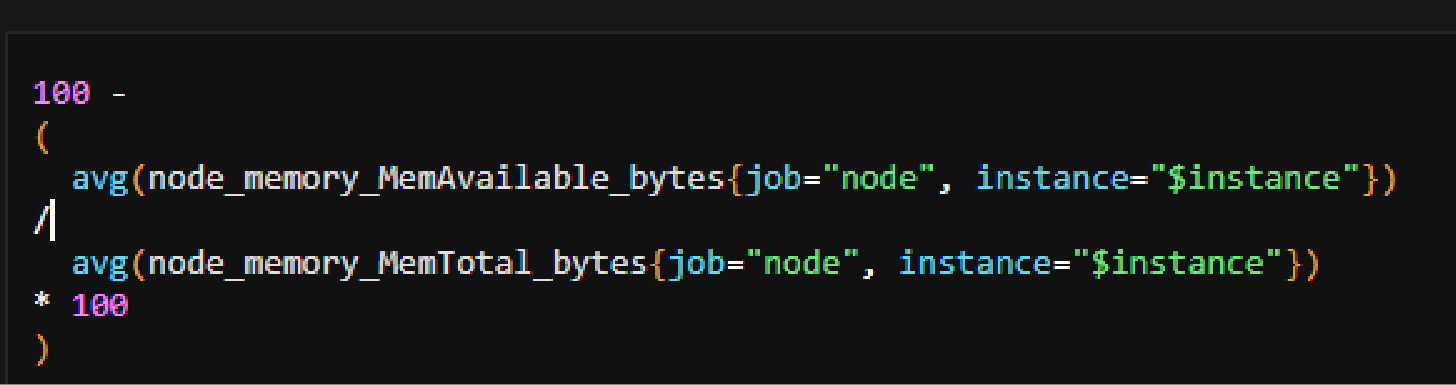
This may seem complex for now, however if you break it down, you should be able to get an idea of what the query is doing to get the percentage memory used:
(100 - (available/total) * 100)
As a demonstration to explore adding a new panel to a dashboard, we will add a duplicate of the existing panel.
The general steps to create a new panel will be:
- On the dashboard screen click the “Add Panel” button.
- Select the panel type – singleStat
- Click the dropdown beside the new panel name and click “Edit”
- Click “Metrics” and set datasource=”Prometheus”
- Type the query above into the box, note how Grafana will autofill fields as you type, this makes writing these queries much simpler.
- Click “Options”
- Check the “Guage” checkbox
- Insert 80,90 in the “Thresholds” box
- In the “Unit” dropdown select none->percent(0-100)
Now to go back to the dashboard click the blue arrow in the top right.
This is the general procedure when adding or editing panels in a Grafana dashboard.
- Add Panel
- Set the Query
- Update Options if neededExplore the Grafana UI further to gain a general feel for it.